Return to : Science Newsletter
 California Science Content Standard 9b maintains that in conducting investigations 8th grade students should be able to evaluate the accuracy and precision of the data they collect. Accuracy tells us how close a measurement is to the correct value, while precision tells us how exact and reproducible a measurement is. The difference between accuracy and precision can be explained and illustrated through the use of a dart game.
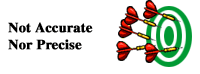
In the picture below the darts are randomly spaced upon the board and there is no accuracy or precision.
California Science Content Standard 9b maintains that in conducting investigations 8th grade students should be able to evaluate the accuracy and precision of the data they collect. Accuracy tells us how close a measurement is to the correct value, while precision tells us how exact and reproducible a measurement is. The difference between accuracy and precision can be explained and illustrated through the use of a dart game.
In the picture below the darts are randomly spaced upon the board and there is no accuracy or precision.
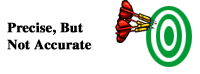
In the next picture the darts have been precisely thrown and are all close together, but there is no accuracy - they miss the bull's-eye.
 In the following picture the darts are thrown accurately, with one dart hitting the bull's-eye and the other four evenly spaced around it, but there is no precision. If the four darts outside of the bull's-eye were to represent data then their average would fall within the bull's-eye.
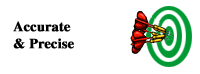
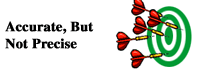 The final picture below illustrates both accuracy and precision.
 Because the tools we use have their own limitations, it is never possible to make perfect measurements. At the same time, it is possible to take careful measurements and to keep our accuracy and precision within acceptable limits.
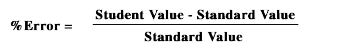
When a standard value that is being measured is known, such as as the density of water (1.0 g/mL), the accuracy of data can be calculated by determing the percent error, which compares the value obtained by the student to the standard value.
Because the tools we use have their own limitations, it is never possible to make perfect measurements. At the same time, it is possible to take careful measurements and to keep our accuracy and precision within acceptable limits.
When a standard value that is being measured is known, such as as the density of water (1.0 g/mL), the accuracy of data can be calculated by determing the percent error, which compares the value obtained by the student to the standard value.
 Whenever we do experiments where repeated trials are used the precision of of the data collected can be determined by calculating the percent difference using the formula below.
 As students in this class perform experiments and collect data it is very important that they are focused on what they are doing and take the time and effort to ensure that their data is as accurate and precise as possible.